Shaping Time: Dutch Museum Opens Design Exhibition by Digital Culture Guru Lev Manovich
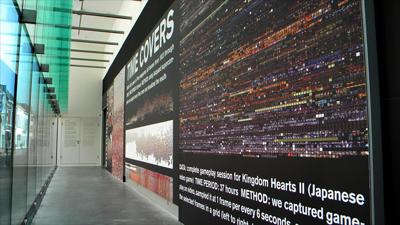
San Diego, May 11, 2010 -- Some 18,000 visitors attended opening day in mid-April at the Graphic Design Festival in The Netherlands. A major attraction at this year’s festival was the start of an exhibition called “Shaping Time,” a work by UC San Diego Visual Arts Professor Lev Manovich and his colleagues Jeremy Douglass and William Huber in Calit2’s Software Studies Initiative (SSI).
|
With funding from a variety of sources, SSI is developing new tools for analyzing massive amounts of visual data ranging from millions of comic book pages to tens of thousands of paintings representing the complete production of a number of artists. The goal: to reveal interesting patterns and insights across large-scale cultural data sets.
|
“Lev Manovich is one of the most distinguished thinkers in the area of new media and digital culture,” announced the museum website. “Besides being a scientist, Manovich is also an artist, a designer and a programmer.”
|
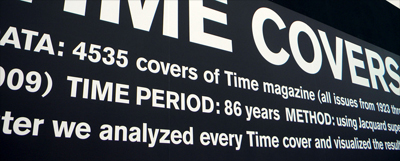
For the Breda exhibit, Manovich shows how even in a static, non-digital medium, viewers can take away a keen awareness of how the design and content of the magazine changed over time – in a way that would be unthinkable just looking at one cover at a time.
According to the museum, “When you take a closer look at the images, the significance in the design becomes clearer. Because of this approach, the images become pieces of art on their own.”
"The visualization of the Time covers reveals the gradual changes in the design and content of the magazine," said Manovich. "For example, it shows how color was introduced over time, with color covers slowly becoming more common. We also see how the color saturation and contrast of the covers gradually increases over the 20th century. Surprisingly, 10 years ago this trend reversed. Our visualization shows the actual covers instead of standard statistical graphs and statistics, so the design can reveal many more trends in one glance – which makes it far more interesting and accessible to a wider audience than statistics can.”
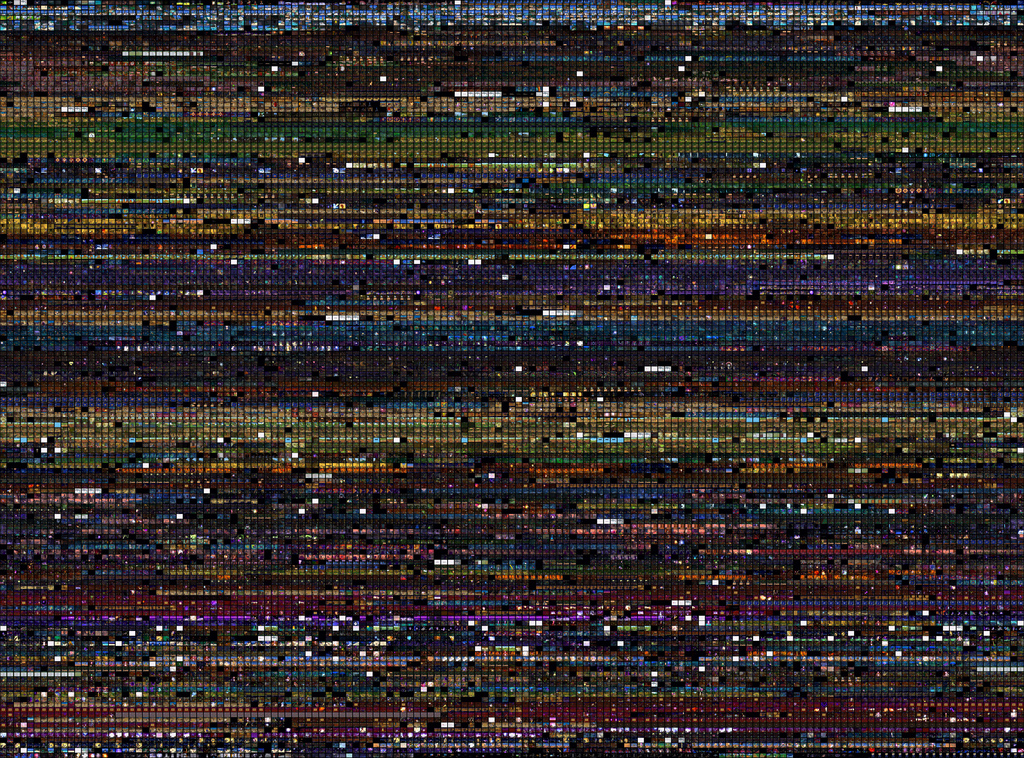
In addition to the visualizations of Time covers, the exhibition includes a visualization of a popular Japanese video game, Kingdom Heart II. It consists of 22,500 individual images sampled from a 37-hour-long video of game play. The arresting visualization allows visitors to see both the overall aesthetics of the game world and also the visual and narrative changes within a single game’s progression. UCSD Visual Arts Ph.D. student William Huber, who created the visualization, is currently working on visualizing more games as a part of his dissertation research on game culture.
|
Funding for the research underlying the “Shaping Time” exhibition came from the UCSD Division of Calit2, UCSD’s Center for Research in Computing and the Arts (CRCA), UC San Diego, and the National Endowment for the Humanities (NEH). Data processing services were provided, in part, by the National Department of Energy Supercomputer Center (NERSC). The exhibit was designed by Graphic Design Museum director Mieke Gerritzen. For more information about cultural analytics and the research of the Software Studies Initiative, visit http://softwarestudies.com.
Related Links
Software Studies Initiative
Graphic Design Museum
Media Contacts
Doug Ramsey, 858-822-5825, dramsey@ucsd.edu


