
New GeoMedia Analytics Platform Combines Photo Sharing and Mapping Tools
San Diego., Calif., Feb. 26, 2014 — Imagine setting out from Greenwich Village and moving northward up New York City’s Park Avenue. As you pass Grand Central Station, a cloud of images pops into view — young couples capturing a moment while waiting on a train platform, families taking group shots in front of Grand Central’s iconic clock.
|
Farther up the avenue, in the Bronx, more photos pop up, many of them with overlays: “Loyal Knicks Fan” they say, or “Half off at the Magnet Lounge.”
Of course, a walk up Park Avenue hasn’t reached such “Minority Report” status yet, but a new interactive user interface designed at the University of California, San Diego’s Qualcomm Institute (QI) provides a virtual experience that could one day come pretty close.
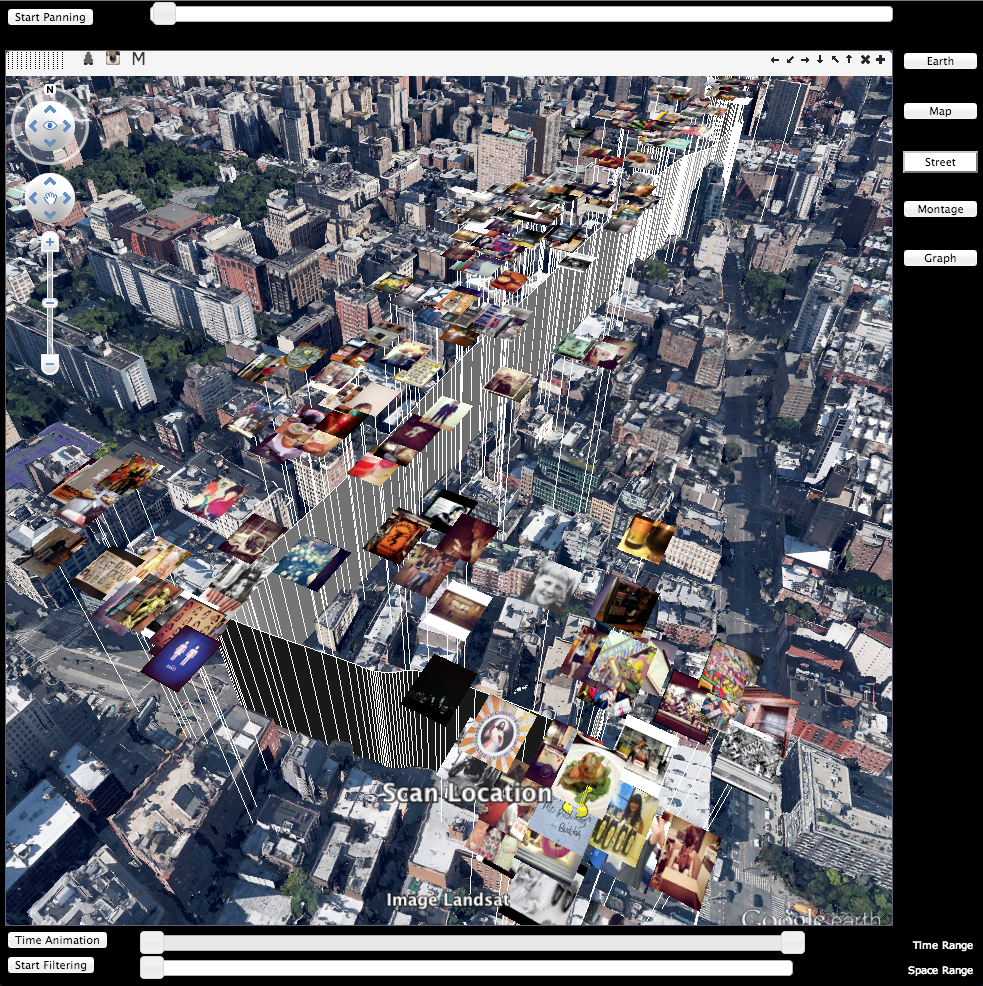
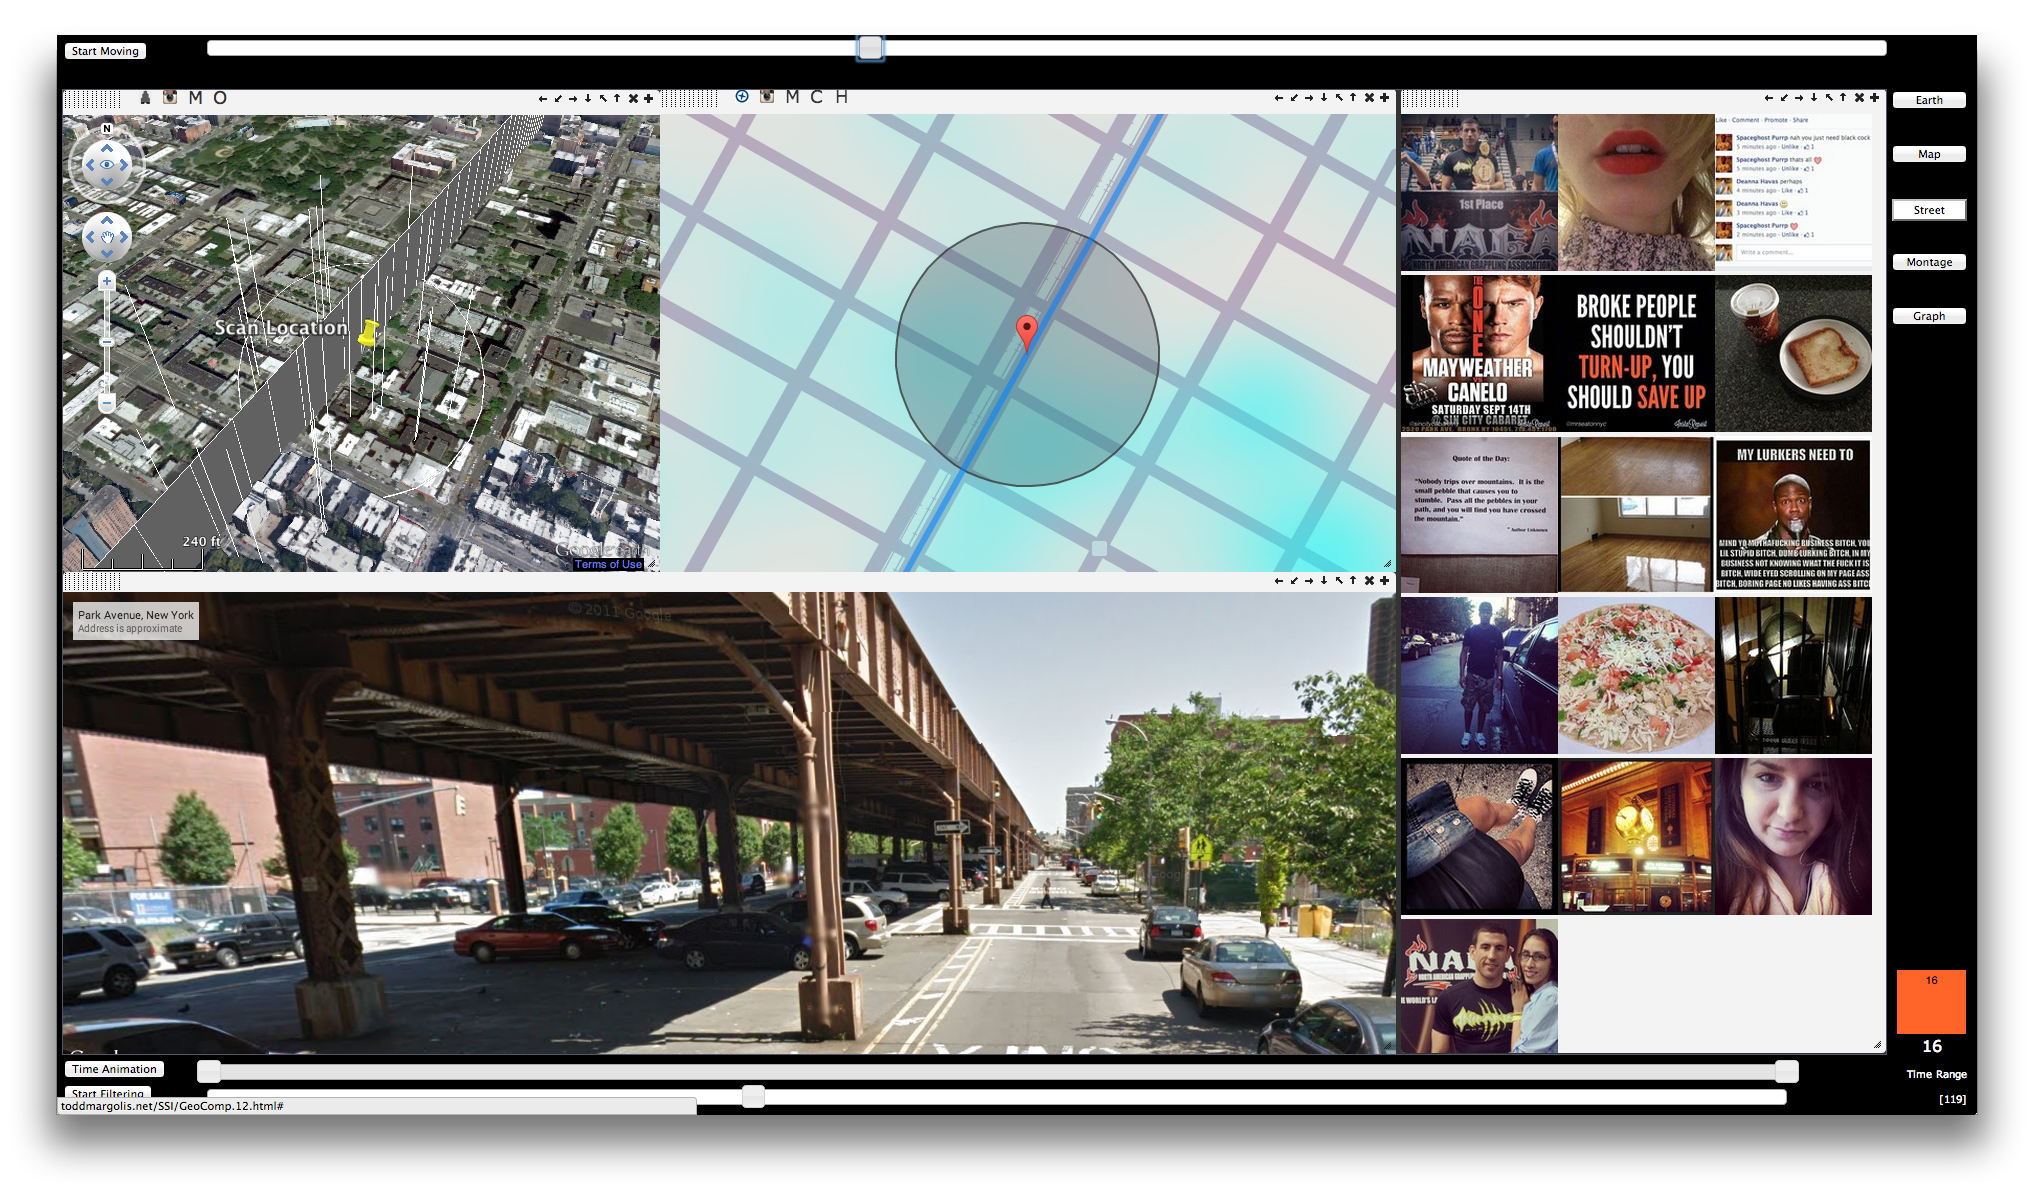
The newly designed GeoMedia Analytics Platform, designed by QI's Todd Margolis, weaves together application programming interfaces (APIs) from a variety of software applications to create a complex, multi-modal tool for investigating large cultural datasets in the public domain, such as photos from a popular photo-sharing social network. By integrating Google’s rich suite of mapping tools, notably Google Maps, Google Earth and Google Streetview, the GeoMedia interface also makes it possible to analyze the data within a geographical context and determine if cultural differences exist from one neighborhood to the next.
“We’re interested in learning how we can intuit patterns and find meaning in these datasets,” says Margolis. “There is a growing demand for geospatial analytics that hasn’t been standardized yet, which allows us to contribute new creative means to present and navigate this multi-dimensional data. By pulling up different visualization modules and being able to look at them with spatio-temporal synchronicity, it gives us a new potential for finding meaning and communicating that information to others.”
After selecting the scan location in Google Earth or Google Maps, the user can then turn on “pins” that represent individual photos uploaded to a social network. The interface reads the metadata associated with each photo to determine where they are geo-located, and then, like magic, they pop up in the Google modules in the exact spot where they were taken. The interface can sort images by date and time, and even by user.
“Through image recognition,” explains Margolis, “we can determine things like what foods are people eating, do they spend more time indoors or outdoors or even who are then spending time with. Or we can follow the path an individual person took as they made their way through the city, snapping photos and uploading them to the public domain.”
|
Margolis notes that he is careful not to make assumptions while analyzing the data. “I like to have the most skeletal preconceived notions as possible and let the patterns jump out at me,” he says.
The Web-based prototype was mostly programmed in Javascript using a responsive design targeted primarily at a 4K desktop display (which offers four times the resolution of high-definition TV). Ultimately, however, it will be scalable from a smartphone up to the Qualcomm Institute’s 100-million-pixel tiled display wall.
Aside from its applications as a cultural analytics tool, Margolis says he envisions it being used for everything from urban planning to understanding environmental health concerns.
“Let’s say a power company is trying to figure out where to invest its money,” he says. “You could use this tool to simultaneously view the Google Maps 'heatmap' filter to see where the most energy is being consumed, as well as Google Streetview to determine if the tree on the corner of Lexington & Third is getting too tall and is ready to hit a power line.”
Or, he adds, a researcher could use the tool to see where people report having higher incidences of asthma attacks and correlate that with the local environment to determine which neighborhoods should be avoided at certain times of the day due to high industrial pollution or other factors. According to Margolis, one day visitors to the Big Apple may be able to compare neighborhoods to determine which is the most hip, or the most frequented by tourists.
Related Links
Media Contacts
Tiffany Fox, (858) 246-0353, tfox@ucsd.edu