
Visualizing the Earth, Earthquakes... and More
|
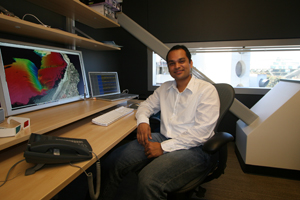
San Diego, CA, April 6, 2006 -- With the 100th anniversary of the 1906 San Francisco earthquake looming on April 18, television news crews will be clamoring for ways to visualize seismic data. Two of the most illuminating display technologies in the news this week are deployed at Scripps Institution of Oceanography, and both were built in cooperation with Calit2. "We have multiple projects that demonstrate the close collaboration between Scripps and Calit2 in scientific visualization," says Scripps computer scientist Atul Nayak, who works two days a week at Calit2.
One is the Highly Immersive Visualization Environment (HIVE) Panoram projection system in the Visualization Center at Scripps , a floor-to-ceiling display technology that allows groups of researchers to immerse themselves in 3D images and animations. The other is iCluster, a 50 million pixel (50-megapixel) tiled display where each of 12 tiles is a 30-inch Apple Cinema Display. Both systems have helped Scripps and Calit2 scientists visualize large data sets, as does the PC-based, LambdaVision 105-megapixel tiled display system now installed in Calit2's own Immersive Visualization Laboratory.
|
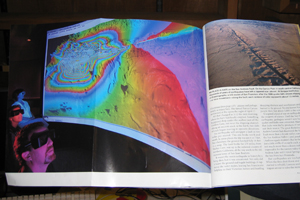
The HIVE system, co-funded by Calit2, has been in place since March 2002, but it still can impress. Indeed, a two-page image in the April 2006 "Quake" special issue of National Geographic magazine (at left) features a fold-out photo of the HIVE at Scripps. On the screen, which engulfs three scientists wearing 3D glasses, is a three-dimensional simulated representation of California deformation caused by the San Francisco quake. The image was created by Scripps geologist Bridget Smith for her doctoral dissertation, "Three-dimensional Deformation and Stress Models: Exploring One Thousand Years of Earthquake History along the San Andreas Fault System," with the assistance of researchers at the Visualization Center.
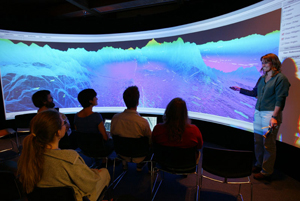
The immersive visualization system remains in frequent use, especially for collaboration and education when large groups are involved. But as Visualization Center director Graham Kent told Apple Computer science writer Frank Lacombe in a lengthy case study published this week on Apple's website, one of his goals as director has been to have as many visualization options as possible. "Our 10' x 30' curved-screen Panoram stereo projection system is amazingly effective when collaborating with 40 scientists or running outreach programs for dozens of kids -- and at one time it represented the cutting edge in scientific visualization tools," Kent is quoted saying. "Today, we need more resolution than standard projection-based solutions can realistically provide."
|
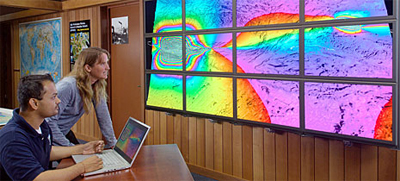
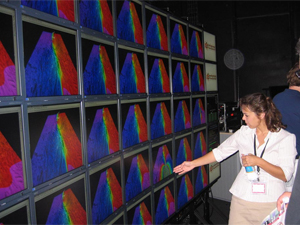
Indeed, the approximate ceiling for commercial projection-based resolution is 3.2 million pixels (although Calit2's auditorium now boasts an experimental 8-million-pixel 4K Sony projector that offers four times the resolution of high-definition TV. By contrast, the new Mac OS X-based iCluster offers 50-megapixels. Mounted on a wall, the system's 12 tiles are driven by six Power Mac G5 systems running a combination of Apple software and open source graphics middleware developed at the University of Illinois at Chicago's Electronic Visualization Laboratory (EVL), UCSD's principal partner in the OptIPuter project led by Calit2 director Larry Smarr. Funding for iCluster came from Calit2 and two Scripps-based, NSF-funded projects: the EarthScope program's USArray Network Facility (USANF), and the Real-time Observatories, Applications, and Data management Network (ROADNet).
|
Scripps' Atul Nayak, who has worked on several joint projects with Calit2, told Apple's Lacombe that one of the benefits of systems such as the iCluster is the sharper and brighter image compared to any type of projection technology -- which really matters, for instance, when TV crews visit Scripps and want to show their viewers seismic data after an earthquake. "They want our scientists to explain the seismic forces that caused the event and give the TV audience an idea of what to expect in terms of aftereffects," Nayak told Apple. "Until recently, we solely used our… projection-based display system to present visualizations to the reporters. But the iCluster's Apple Cinema Displays create a much sharper and brighter image that comes across very well on camera."
The iCluster was developed and built by Nayak, Kent, Visualization Center science director Debi Kilb and other Scripps colleagues, with help from Calit2 staffers including Greg Dawe. With Earth sciences one of the two "driving" applications of the Calit2-led OptIPuter project (the other is biomedical imaging), Scripps also benefited from SAGE (Scalable Adaptive Graphics Environment), an open-source graphics middleware technology to allow sharing of visualizations between iCluster and other systems at different resolutions.
|
The iCluster visualization system was shipped to the Supercomputing 2005 conference in Seattle and the American Geophysical Union meeting last fall in San Francisco for demonstrations in the joint booth of Calit2 and the Scripps-based Center for Earth Observations and Applications. "We also created interactive visualizations of all of Bridget Smith's models and used them for a demonstration on Calit2's LambdaVision system during iGrid," says Nayak, referring to the international networking workshop and symposium hosted by Calit2 last fall.
To read more about how iCluster was built and ways in which it is being used as part of Scripps and Calit2 research endeavors, the three-part Apple case study -- "Scripps Institution of Oceanography: Seeing the Big Picture" -- is online at http://www.apple.com/science/profiles/sio/.
Related Links
Apple Science: Seeing the Big Picture
National Geographic
Visualization Center at Scripps