

Calit2 Unveils First Optical Network Linking
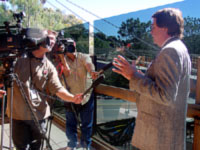
 3.6.02 - The Calit² Visualization Center at Scripps Institution of Oceanography on March 4 opened its doors to a packed audience of media, industry and university representatives. And after working long hours to get the unprecedented system linking two widescreen (3.2-million-pixel), "immersive" environments via a 44-mile, 2.6 gigabit-per-second optical pipeline, the demonstrations were flawless. The multi-million dollar venture is the world's first such visualization complex dedicated to Earth and ocean sciences. As the San Diego Union-Tribune reported the morning after the Visualization Center launch, "UC San Diego and San Diego State University unveiled a prototype for a scientific network that promises to change the way humans understand, react and adapt to the world around them."
 "As overpowering as the visualization capability is, even more powerful is that it is a shared experience across the San Diego metro area," said Calit² director Larry Smarr (video) , a professor of computer science and engineering at UCSD's Jacobs School of Engineering. "We have plans to build this out with optical networks to all of southern California, all of California, linking across the United States and within a year even internationally."
At the dedication ceremony for the permanent visualization center at Scripps' Cecil H. and Ida M. Green Institute of Geophysics and Planetary Physics (IGPP) in La Jolla, IGPP director John Orcutt (video, dedication video) noted that "the Center takes our ability to visualize and understand huge environmental and other data sets to a new level." The Scripps center is connected to SDSU's Center for Immersive Telecommunications for Global Exchange (C IT Global E), dedicated in January, and Center director Eric Frost (video) participated in the ceremonies via videoconferencing on the big screen.
 Smarr, Orcutt and Frost all underscored the strong cooperation between academic and industry partners that was required to make the metro-area visualization complex a reality. Senior representatives from SGI, Panoram Technologies, TeraBurst Networks and Cox Communications were on hand, giving demonstrations of the technologies that were required to build the complex linking the center at Scripps to a similar facility at SDSU's Center for Immersive Telecommunications for Global Exchange:
 The SGI® Onyx® 3400 visualization system powers the Scripps center and is equipped with InfiniteReality3™ graphics and 16 processors. Representing SGI, Senior VP of Marketing Jan Silverman (video) introduced the concept of Visual Area Networking to the gathering of customers, reporters and university administrators early in the day, pointing out the remarkable confluence between the Calit² and VAN goals for collaborative visualization as decision-making tool.
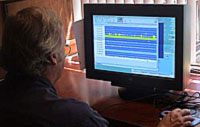
 "SGI is pioneering Visual Area Networking, and the Calit² project demonstrates how SGI-powered visualization systems provide the infrastructure for collaborative, group decision-making environments. No other company can offer large systems with advanced visualization capability to geographically distributed audiences, whether they are distant company offices sharing images over the Internet, scientists or workers in remote field settings or command-and-control centers of the type implemented at Scripps." Silverman, at Scripps, demonstrated the use of a wireless tablet to receive an image from SDSU and to take control of and manipulate that image, with SDSU staff observing those changes-15 miles away-at their site in real time.
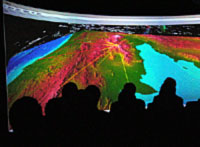
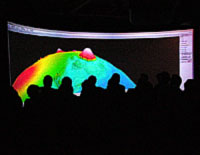
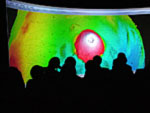
 The two sites are anchored by Panoram Technologies' panoramic screens and 3-D projection systems. The Visualization Center at Scripps is built around a Panoram® GVR-120E curved floor-to-ceiling screen (8'6"X28'4") featuring 3.2 megapixel resolution (3,276,800 pixels). The "immersive" environment is ideal for groups of up to 60 people who can view the same large-format images at the same time. "
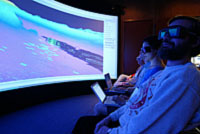
 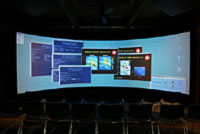 The optical bandwidth linking the Panoram systems is at least twenty times the bandwidth of network television," said Theo Mayer (video) , President and CEO of Panoram Technologies. "A remotely shared system like this one will change the way scientific visualization is done, just as it already has changed the working methods and cultures of industries such as oil/gas and aerospace that use high-resolution computer imaging and modeling." The system is equipped with transmitters and LCD shutter glasses which permit stereographic 3-D viewing of high-resolution images. The three projectors use advanced technology to automatically blend the edges where their video outputs meet.
 The optical switches at both ends were supplied by TeraBurst Networks. The massive amount of data to be transmitted instantaneously between the two centers requires a new type of high-performance, optical networking platform. TeraBurst Networks developed WAVS (Wide Area Visualization Solution) to address that need. WAVS is based on high-bandwidth technology that is capable of aggregating video, audio and LAN data into optics and connecting disparate locations at data rates required for real-time collaboration. "We are excited to be part of this unique effort to connect two separate immersive environments, bringing them into a virtual space that will expedite collaboration and decisions," said TeraBurst chief operating officer Tom Myers (video) . "It is currently the only solution of its kind that will allow video, audio and data to be transmitted simultaneously over the wide area optical network to multiple, remote centers focused on immersive visualization for several disciplines-including Earth sciences, telemedicine, astronomy, oil and gas, manufacturing and energy."
 The Visualization Center at Scripps is linked to SDSU's facility via high-bandwidth optical fiber installed by Cox Communications. For the first time ever, the link allowed two immersive visualization centers to share wall-to-wall images in real time. "One key word echoed here today is collaboration," said Paul Shortal (video), Manager of Business Development for Cox Business Services. "The value and benefit of collaboration is being tangibly demonstrated today. Not only are we collaborating with technology partners, but we are also collaborating with academia and other private businesses. It's a very cool thing and we are very excited to be a part of it."
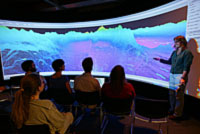
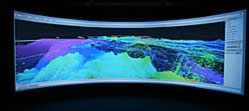
 The optically-networked visualization centers allow groups of researchers at both locations to work in real-time on large data sets in the form of 3-D images projected on high-resolution wall-sized screens. Initially, teams at both universities will share data and collaborate on analyzing seismic and climate studies for the High Tech Coast (from Santa Barbara to San Diego); the interior structure of Earth, including its oceans and atmosphere; the variability in California's water supply; fault-related deformation as seen from space; the structure and dynamics of coastlines; and the impact of global warming on Earth's climate.
IGPP director Orcutt, a professor of geophysics at Scripps, led off a series of presentations demonstrating some of the uses of the optically-linked large-screen centers. SDSU's Eric Frost, participating via videoconferencing on the large screen, talked about the revolutionary optical connection and demonstrated how large-scale visualizations running at the SDSU facility could be viewed simultaneously at Scripps-and vice versa. Graham Kent, a Scripps researcher who orchestrated the system's build-out, demonstrated the versatility of the system, including the ability to fly-over or through topographical and other images-even in 3-D.
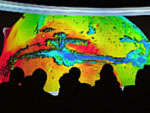
 Scripps seismologist Frank Vernon (video one, video two) demonstrated real-time seismic data acquisition and the implications for earthquake hazard response. Debi Kilb (video), a post-doctoral research fellow at IGPP, showed reporters and industry representatives a series of visualizations depicting the magnitude, frequency and scale of earthquakes and aftershocks in southern California. Keeping with the theme, Scripps professor David Sandwell (video) demonstrated the integration and visualization of offshore and onshore topographic data-illustrating his point with images of on and offshore San Diego county, including the topography of the ocean floor.
 Catherine Johnson (video) , also a faculty member at IGPP, navigated the stunning topography of Mars-in 3-D-demonstrating how large-scale visualization can be used to better understand topographic data and geophysics of a distant planet. Then IGPP's Graham Kent (video one, video two) took the audience on a 3-D tour of Lake Tahoe based on satellite topographic data, and demonstrated the integration of seismic and topographic data.
Also on hand: Fran Berman (video) , director of the San Diego Supercomputer Center (SDSC). SDSC, located on the UCSD campus, is the network access point for the optical link between Scripps and SDSU. Berman stated that the supercomputer center will both support and use the Visualization Center, providing new capabilities for analysis of large geographic data sets by its Data and Knowledge Group.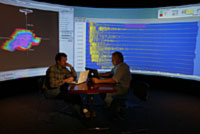 "This is one of the best tools to visualize immense amounts of data, which then has to be analyzed and synthesized and made into knowledge that is usable for all of us," said Berman during the dedication ceremony. "We know how important this project is and we're delighted to be part of it." Also speaking at the dedication and launch of the link between the two universities: the Dean of SDSU's College of Sciences. "The Visualization Center is a project of magnificent proportion and almost limitless applications," said Thomas Scott (video) . "It represents the best of collaboration, bringing together three large universities and four major corporations to redefine the manner in which we communicate with one another." Earlier, Scott said he sees "this link across San Diego eventually expanding across California-and someday the world."
Charlie Kennel (video) , director of the Scripps Institution of Oceanography, highlighted the role of visualization in shortening the time between scientific discovery and useful applications. "The marriage of information technology and visual processing is going to lead to new insights in science," said Kennel. "Not only are we creating a system that is continuously aware of the Earth's processes, but it's a system that will make human beings continuously aware of those processes."
At the conclusion of the dedication ceremonies, SGI's Silverman took a moment to present a plaque to Calit² director Smarr. It was inscribed with the words:
"In appreciation for the commitment by Calit² to the vision that inspired the implementation of Optically Linked Immersive Visualization Centers. Leading the way to the next generation of collaborative tools."
Related Links
Scripps
SGI
TeraBurst
Panaram Tech
COX
Related Articles
Immersive Visualization - Panoram Status