

NSF and Science Honor Scientific Animation Advances at UC San Diego
GlyphSea and Whole Brain Catalog Win Awards in Visualization Challenge
San Diego, March 3, 2011 -- UC San Diego researchers affiliated with Calit2 – Jürgen Schulze and Mark Ellisman – are on two of the winning teams in the 2010 International Science & Engineering Visualization Challenge. The Challenge is organized annually by the National Science Foundation (NSF) and the journal Science.
|
GlyphSea
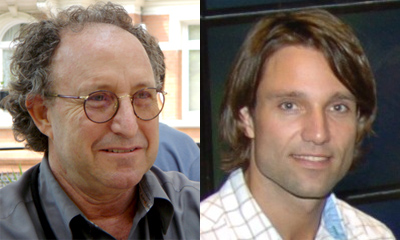
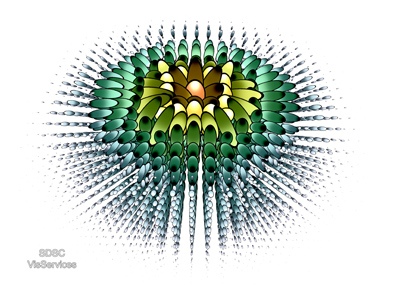
Calit2 research scientist Jürgen Schulze was part of the GlyphSea team led by Amit Chourasia of the San Diego Supercomputer Center (SDSC). GlyphSea is a novel way to encode and display vector data that clearly shows magnitude and direction. The project’s name refers to the use of glyph shapes, such as ellipsoids or spheres, which are marked at each end to allow observers to easily identify both the direction and intensity of the movement. This new visualization technique may help seismologists to accurately analyze ground movements for an earthquake, measure magnetic turbulence in deep space, or allow medical researchers to study areas such as blood flow and nutrient absorption.
The basic work on GlyphSea was done by Emmet Mcquinn, a Master’s student in computer science and graduate research assistant at SDSC, who was advised by Chourasia and Schulze. His thesis committee included Schulze, Chourasia, Jean-Bernard Minster of the Scripps Institution of Oceanography’s Institute of Geophysics and Planetary Physics (IGPP), and Calit2 director Larry Smarr. In the Visualization Challenge, Chourasia, Mcquinn, Minster and Schulze were cited for their work on GlyphSea.
|
With GlyphSea, the UC San Diego team opted to use simple glyph shapes, such as spheres or ellipsoids, with a white dot on the end moving toward the observer and a black dot on the end moving away. This method can be applied to any arbitrary shaped glyph shape in general. By varying size and color to show magnitude, the method can display any kind of motion intuitively, from a major earthquake on the San Andreas fault to magnetic turbulence in stars millions of light-years from Earth.
“We wanted to experiment with immersive and large resolution displays and Calit2 is one such unique place where you not just find hardware, but expertise to accomplish your ideas,” said SDSC’s Chourasia. “The stereo immersive environment in the StarCAVE enables increased depth perception, and increased resolution allows us to view a very large number of glyphs distinctly.”
|
Schulze also helped Mcquinn adapt his algorithms for use in Calit2’s 360-degree StarCAVE virtual-reality environment.
“The strength of this method is that it is not only simple, but very intuitive.” said Chourasia, in noting that the application could potentially be used across a wide range of science domains. “GlyphSea could also be used to render visualizations to display the magnitude and direction of movement within the human body, such as blood flow. That’s because one of GlyphSea’s key benefits is that it can be used to show features at both the macroscopic and microscopic level. Moreover, the application is interactive, where various parameters could be customized and changes could be viewed in real time.”
Referring specifically to the to seisomological visual rendering created by the research team, Scripps’ Minster said that GyphSea’s technique of encoding and displaying orientation information of vector data by using procedural dipole texturing is what makes this application so unique. “This allows seismologists to study the ground motion dynamics at a level of detail not seen before,” said Minster.
Whole Brain Catalog
Another of the four winning teams that tied for second place in the non-interactive media category was cited for a “Visualization of the Whole Brain Catalog.” The Whole Brain Catalog (WBC) project is based in UC San Diego’s Center for Research in Biological Systems (CRBS) and led by its director, UCSD neuroscience and bioengineering professor Mark Ellisman. Ellisman and his WBC team worked with animator (and 2010 MacArthur Fellowship ‘genius’ awardee) Drew Berry to illustrate a journey deep inside the mouse brain. The video brings to life data from the WBC, a massive database of microscopy and other data sets on the mouse brain.
|
“For a memory, you'd have many, many neurons forming, or connections being broken and new patterns being made,” animator Berry told the journal Science, which notes that Berry hopes the video will inspire a sense of wonder at how the brain works.
In addition to Berry and Ellisman, the Visualization Challenge honored François Tétaz, who composed and performed the original music for the WBC video, and the Walter and Eliza Hall Institute of Medical Research, where Berry is an animator for WEHI.TV. Funding for the video came from the Waitt Family Foundation.
According to organizers of the Visualization Challenge, they received 111 entries from 63 countries in the 2010 award year, with an outside panel of experts in scientific visualization reviewing the finalists and selecting the winners.
The deadline for entries in the 2011 Visualization Challenge is September 15, 2011, and the winners will be announced next February in the journal Science.
Related Links
Whole Brain Catalog
GlyphSea
Center for Research in Biological Systems
National Science Foundation
Science
San Diego Supercomputer Center
Scripps Institution of Oceanography
Media Contacts
Doug Ramsey, Calit2, 858-822-5825, dramsey@ucsd.edu or Jan Zverina, SDSC, 858 534-5111, jzverina@sdsc.edu