

Analyzing Global Growth of Image Sharing Around the World
Number of images shared on Twitter has been doubling every eight months, study concludes
For the first time, a team of researchers is reporting detailed data on the growth of image sharing on the Twitter platform over a three-year period worldwide.
The researchers, led by City University of New York (CUNY) Graduate Center computer science professor Lev Manovich, found that despite a spurt of growth in the use of images on social media in developing countries from 2011 to 2014, urban users in less-developed countries remain far behind their counterparts in more-developed countries – and the gap shows no sign of closing.

Manovich – who remains a visiting researcher in the Qualcomm Institute (QI) at UC San Diego – unveiled the “Visual Earth” project’s findings this week. The researchers are based in Manovich's Cultural Analytics Lab, located in both New York (CUNY) and San Diego (QI). They include CUNY Ph.D. student Agustin Indaco, QI research scientist Mehrdad Yazdani, UC San Diego cognitive science alumnus Damon Crockett (Ph.D. ’15), who is now a postdoctoral researcher at Yale, and Moscow-born, New York-based Daniil Sergeev, who is responsible for the project’s creative direction and design.
“Visual Earth” was unveiled Nov. 28. It tackles how people around the world are sharing and curating images, which have become the dominant form of social media content (thanks to the growing use of smartphones and the rise of media sharing sites).
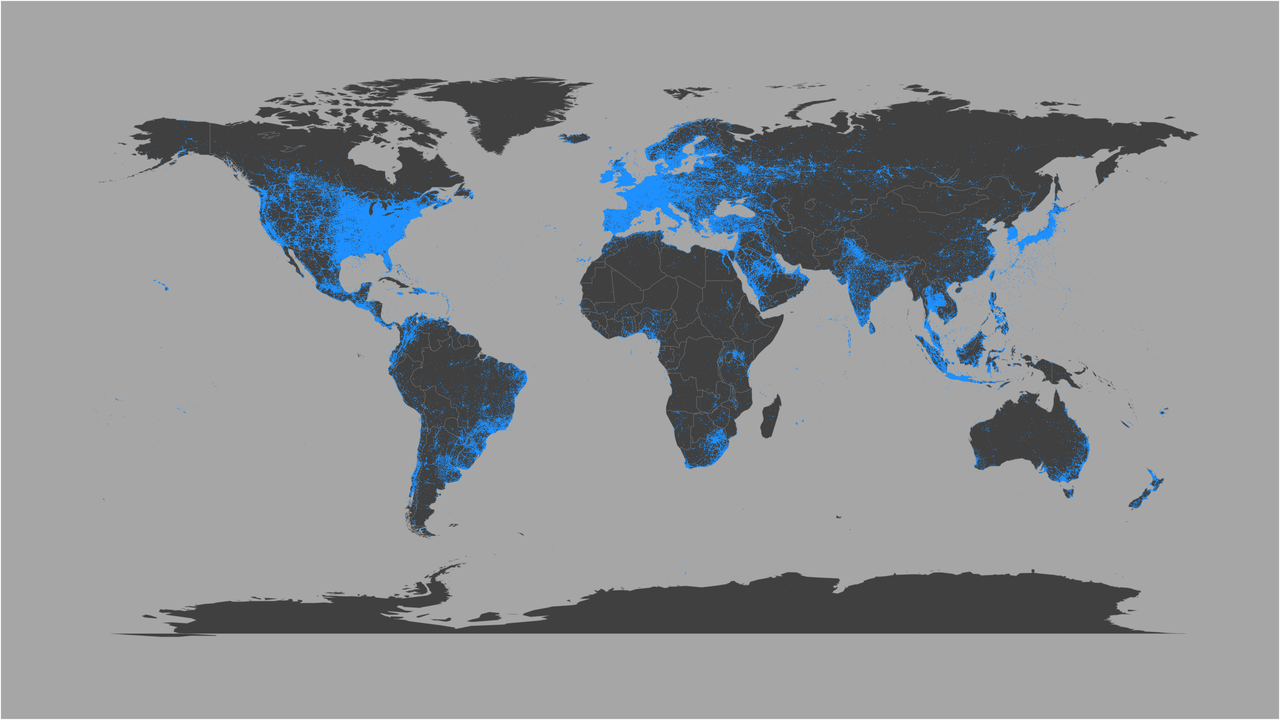
The study’s dataset contains all geo-coded images shared on Twitter worldwide between September 2011 (when Twitter first enabled users to share images) and June 2014. It contains 270 million images and Twitter posts. “We were able to work with 270 million images thanks to Calit2’s Qualcomm Institute, which gave us access to a computer with very fast Internet connections and a large amount of memory for faster computation,” said Manovich. “We used it throughout our work on the Visual Earth project -to download, organize and process the images and data.” The massive data used in the study was given to the project team by Twitter after Manovich’s proposal was selected to be one of only six groups worldwide to win Twitter’s inaugural #DataGrant competition in 2014.
In the three months after November 2013, when Twitter first allowed users to display image previews within tweets, image sharing doubled. Over the entire period from 2011 to 2014, they found that the number of images shared worldwide on Twitter grew by an average of nearly 12 percent every month. This means that the numbers of shared images on average doubled every eight months.

In presenting their findings on the Visual Earth website, the team took a deep dive in order to understand image sharing trends in 100 cities on five continents. Rather than only considering the world’s largest cities or capitals, “we selected these cities using different criteria to better represent the diversity of urban life today,” explained Yale’s Crockett, who oversaw the selection of cities. “We started with a list of 500 urban areas with at least one million people. We then chose 100 cities from this list. Each city needed to have at least 15,000 visual tweets, and no country could have more than one city.”
The team went further to make differences in image sharing rates more meaningful. They restricted the analysis to images shared from a 10-by-10-kilometer central area of each city.
The resulting data showed large differences in image sharing behavior between cities. Major factors driving those differences included income, geography and the age of people sharing photos on Twitter. “We found that image sharing was growing much faster in cities in low-income countries than in cities in high-income countries,” said Indaco, a Ph.D. student in economics at CUNY’s Graduate Center. “But even with that growth, cities in high-income countries continue to vastly outpace their low-income counterparts in terms of the number of images being shared.”
According to future predictions based on the data analysis, Twitter users in higher-income countries are expected to continue to have the biggest visual representation on social media – even if the growth of image sharing trails behind the sharp increases seen in lower-income countries (which are trying catch up with users who have been taking and posting images for a longer period of time).
"In Western Europe and North America, where image sharing quickly took off after photo sharing was added to Twitter, we believe the trend has a lot to do with high incomes that have allowed for a great deal of smartphone ownership across all age groups," said Manovich. “But in Southeast Asia and South America, we tend to see cities with younger populations and growing economies — two characteristics that explain the growing use of smartphones and rapid adoption of image sharing."
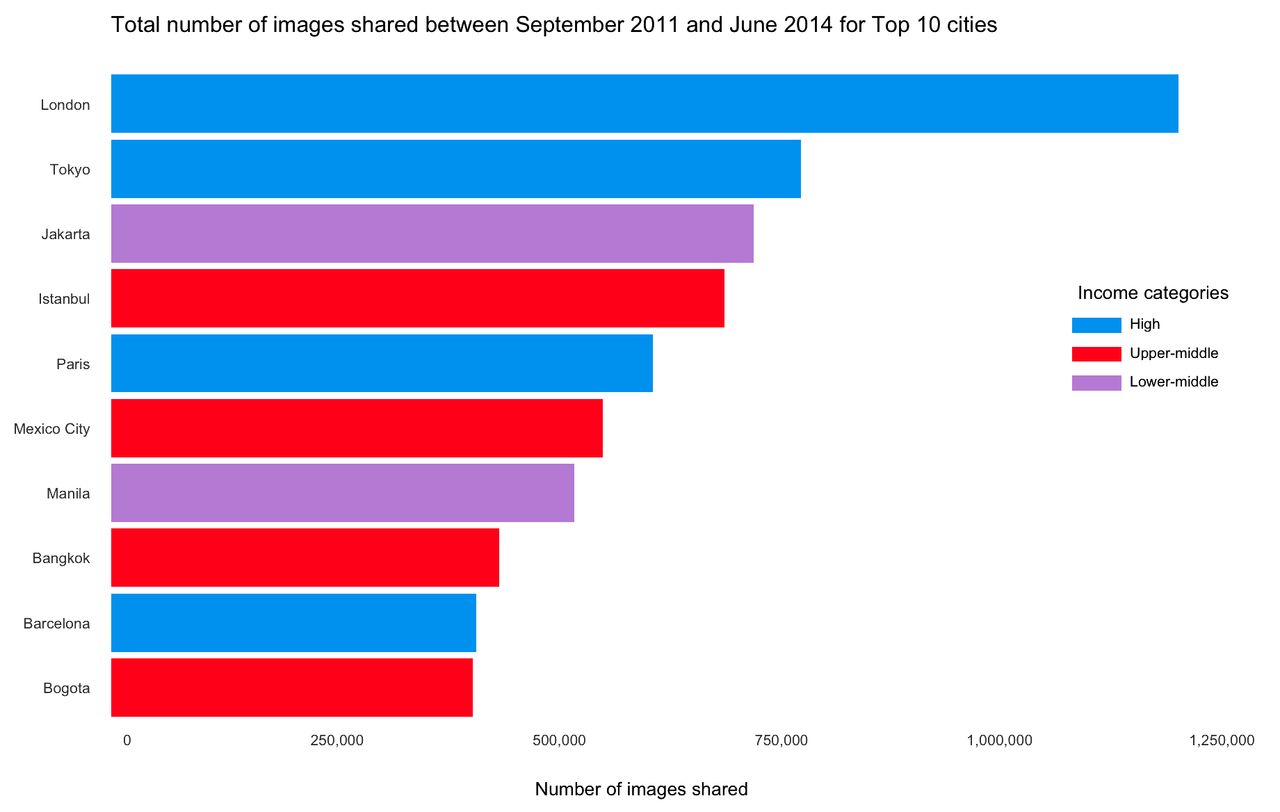
Indeed, the study reveals a connection between the growth in image sharing and geography. The 10 cities with the fastest rate of image-sharing growth are located in low-income countries in Africa and South Asia. But the researchers noted that the 10 cities with the most shared images throughout the study were well-balanced between high, upper middle and lower-middle income cities:
Higher income: Barcelona, London, Paris, Tokyo;
Upper-middle income: Bangkok, Bogota, Istanbul, Mexico City; and
Lower-middle income: Jakarta, Manila.
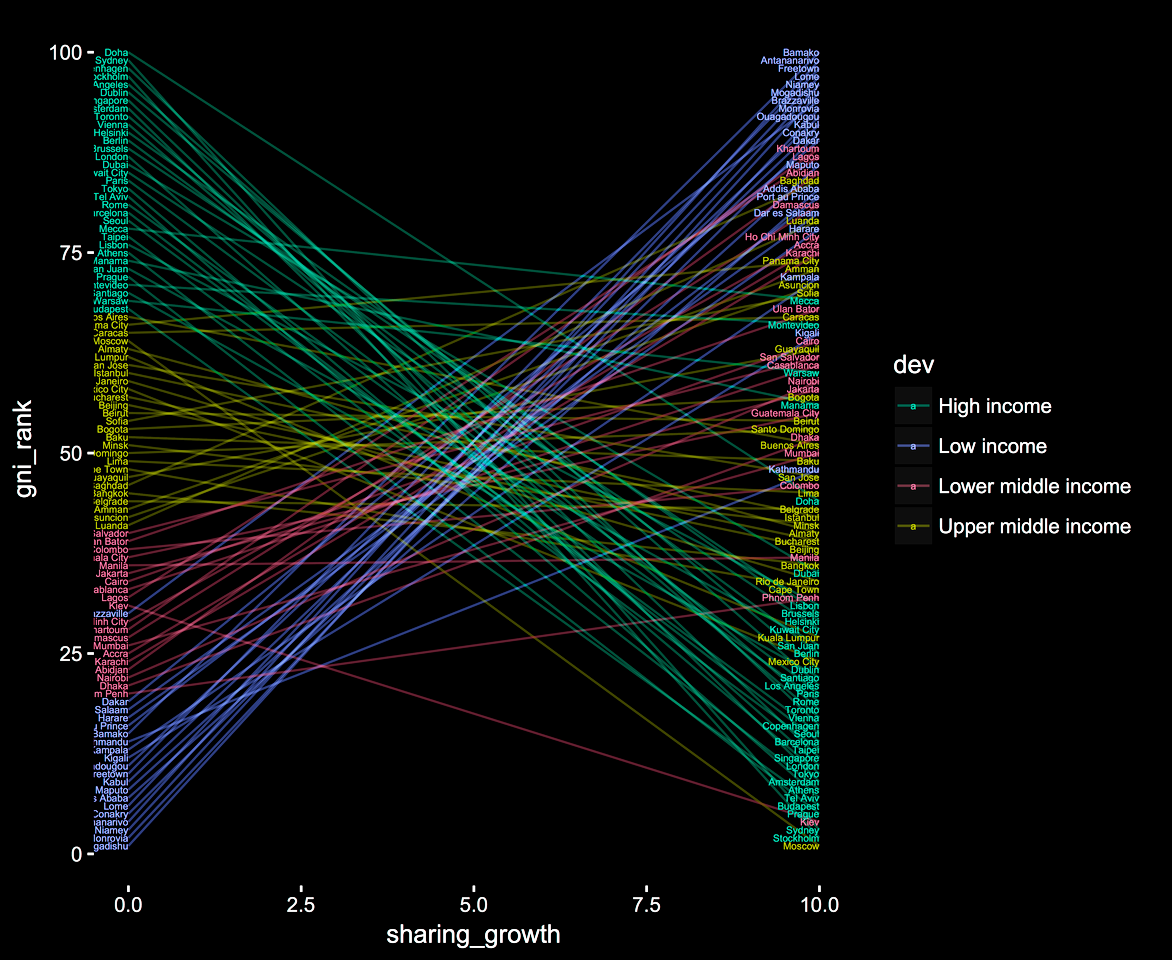
The researchers also analyzed differences in image sharing vis-à-vis levels of economic development for all 100 cities. “We found a systematic relationship between the two phenomena,” said QI’s Yazdani. “The less economically developed a country is, the faster image sharing growth has been.”
Manovich and Indaco also projected trends in growth of image sharing to December 2021. By then, the numbers of images shared in cities located in upper-middle income countries would have caught up and even surpassed high-income users, but the gap in image sharing in these countries and the low-middle and low-income countries did not change.
Looked at a different way, in the middle of 2014. the number of images shared in cities in low-income countries accounted for less than 1% of all geo-coded images shared in 100 cities selected for the analysis. The forecast for 2021 is that image sharing in cities in these countries will account for only 1.1 percent of total images shared. “If this trend continues,” added Manovich, “image sharing in less economically developed countries may never catch up to that of more economically developed countries.”
While low-income areas are far behind, the five cities in the study with the highest average monthly growth rate in image sharing are all in less-developed countries of Africa, ‘led’ by the city of Bamako in Mali – with a 93% growth rate. The city with the least average monthly growth – at under 5 percent – is Moscow in Russia.
In searching for correlations between image sharing and economic development, Manovich and his colleagues did find a better correlation between image sharing and the age of the population. “The younger is the average age of a country, the faster is the growth of image sharing,” said Indaco.
The researchers believe that there may be mixed cultural implications if current image sharing trends continue.
"By the middle of 2014, the top 10 image sharing cities were evenly split between high-income, middle-high income, and middle-low income countries, so it's not only wealthier countries and cultures dominating how the world is represented in social media," said Indaco. "But if image sharing continues at the same rates, cities in low-income countries will continue to be visually and culturally underrepresented in the social media universe."
The development of the Visual Earth project was supported by the Qualcomm Institute of the California Institute for Telecommunications and Information Technology (Calit2) and the Graduate Center, City University of New York (CUNY).
Related Links
Visual Earth Project
Visual Earth Project Video
Media Contacts
Doug Ramsey, UC San Diego, 858-822-5825, dramsey@ucsd.edu or Tanya Domi, Graduate Center CUNY, 212-817-7283, tdomi@gc.cuny.edu