iGrid IV: Visualization and Collaborative Environments
9.10.2005 - This fourth is a series of articles on iGrid describes demonstrations that have strong visualization and/or collaborative environment components.
Visualization
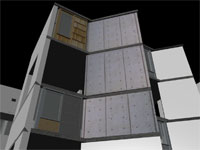
Great Wall Cultural Heritage: An interactive visual presentation using graphical tools and high-resolution videoconferencing enabled by high-speed networks will make it possible for iGrid attendees in San Diego to virtually visit China’s Great Wall. Visualizations of CAD environments will be combined with high-resolution, 3-D scans of physical images and satellite imagery stored on servers in China and San Diego. Visualizations will focus on the Jinshanlin Section of the Great Wall, located in the Hebei Province of China, which was constructed during the Ming Dynasty. Data acquisition from laser scanning combined with photogrammetry enables the construction of unique cultural heritage images from China and forms the medium by which content can be organized and interactively delivered from China to locations worldwide. (See www.internationalmediacentre.com/imc/index.html; demo CH101.)
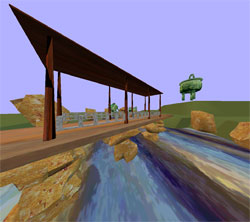
Cabinet of Dreams: This demo highlights the Indianapolis Museum of Art’s Chinese art collection in 3-D virtual reality. Visitors confront surreal worlds: for example, a small mountain landscape with a dragon reveals a philosopher’s inkstone; scenes of country pursuits show layers of lacquers upon a brushpot; and, a ritual cooking vessel carries a precious inscription of a man on a chariot. The actual wood, bronze, and clay ceremonial pieces range in date from 1000 BC to the mid-1800s. They are mediated on 21st-century collaborative networks in an effort to integrate earlier treasures into an extended version of modern reality. (See http://dolinsky.fa.indiana.edu/IMA; demo US120.)
Dead Cat: Using a small, handheld display device, viewers in San Diego will be able to “see” inside the body of a small panther in a bottle of formaldehyde (or a similar substitute). The handheld device’s location, relative to the animal, is tracked, and its coordinates are transferred to Amsterdam, where a volumetric dataset of a small panther, created with a CT scan, is stored. Information is extracted from the database, rendered, and volumetric pictures/frames are sent back to the display, creating a stunning real-time experience. (See www.science.uva.nl/~robbel/deadcat; demo NL102.)
Large-Scale Simulation and Visualization on the Grid with the GridLab Toolkit and Applications: GridLab is one of the biggest European research projects for the development of application tools and middleware for Grid environments, and will include capabilities such as dynamic resource brokering, monitoring, data management, security, information, and adaptive services. GridLab technologies are being tested with Cactus (a framework for scientific numerical simulations) and Triana (a visual workflow-oriented data analysis environment). At iGrid, a Cactus application will run a large-scale black-hole simulation at one site and write the data to local discs, then transfer all the data to another site to be postprocessed and visualized. In the meantime, the application will checkpoint and migrate the computation to another machine, possibly several times due to external events such as system performance is decreasing or a machine is going to be shutdown. Every application migration requires a transfer of several gigabytes of checkpoint data, together with the output data for visualization. The European Commission under the 5th Framework Programme funds GridLab. (See www.gridlab.org/Software/index.html; demo PL102.)
|
|
Virtual Unism: Sculptress Katarzyna Kobro and painter Wladyslaw Strzeminski are two early 20th-century art pioneers who created the Unism art movement. In their 1931 book “Space Compositions: Space-Time Rhythm and Its Calculations,” they describe the mathematics of open spatial compositions in terms of a ratio 8:5. They developed the theory of the organic character of sculpture, a fusion of Strzeminski’s Unistic theory of painting and Kobro’s ideas about sculpture’s basis in human rhythms of movement, time-space rhythm, and mathematical symbolism. Virtual Unism is a networked art piece that explores how Unistic theories can be translated, interpreted, and extended to virtual reality to create harmonic experiences that address the human senses, such as sight with visuals, hearing with sound, and balance with movement. (See www.evl.uic.edu/virtualunism and www.gosiakoscielak.com; demo US102.)
|
Rutopia2: Rutopia2 continues the tradition of Russian folktales by combining traditional folkloric utopian environments with futuristic technological concepts. This virtual-reality art project describes a futuristic sculpture garden with geometric-formed trees that change their shapes in real time under user control. Each tree module is a “monitor,” or mirror, into other worlds that are reflected onto the geometric planes of the trees in high resolution. (See www.evl.uic.edu/animagina/rutopia/rutopia2; demo US104.)
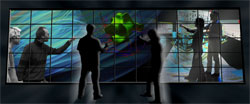
GLVF: Scalable Adaptive Graphics Environment: The OptIPuter project’s Scalable Adaptive Graphics Environment (SAGE) system coordinates and displays multiple incoming streams of ultra-high-resolution computer graphics and live high-definition video on the 100-Megapixel LambdaVision tiled display system. Network statistics of SAGE streams are portrayed using CytoViz, an artistic network visualization system. UIC participates in the Global Lambda Visualization Facility (GLVF). SAGE is a research project of the UIC Electronic Visualization Laboratory, supported by the OptIPuter project. (See www.evl.uic.edu/cavern/glvf, www.evl.uic.edu/cavern/sage, and www.evl.uic.edu/luc/cytoviz; demo US117a.)
GLVF: An Unreliable Stream of Images: SARA has developed a lightweight system for visualizing ultra-high-resolution 2-D and 3-D images. A key design element is the use of UDP, a lossy network protocol, which enables higher transfer rates but with possible resulting visual artifacts. The viewer may tolerate these artifacts more than with lower throughput, as the artifacts have a short lifespan. At iGrid, this lossy approach will be compared to the more robust SAGE system. (See iGrid demo “GLVF: Scalable Adaptive Graphics Environment.”) Visualization scientists from the USA, Canada, Europe, and Asia are creating the Global Lambda Visualization Facility (GLVF), an environment to compare network-intensive visualization techniques on a variety of different display systems. (See http://home.sara.nl/~bram/usoi and www.evl.uic.edu/cavern/glvf; demo US117b.)
GLVF: The Solutions Server over Media Lightpaths: The University of Alberta’s Solutions Server is a suite of tools that couples live computational simulation with visualizations. The Solutions Server, combined with SGI’s VizServer software, streams visualizations to computer consoles of distantly located scientists and engineers over the WestGrid dedicated Gigabit network. The Media Lightpaths project seeks to move toward configurable lightpaths to support on-demand visualizations among non-WestGrid collaborators. Ultimately, the goal is to integrate the User Controlled LightPath (UCLP) technology with the Access Grid. WestGrid peers with Canada’s CA*net 4 infrastructure at a number of locations. Simon Fraser University and the University of Alberta are participants in the Global Lambda Visualization Facility. (See www.westgrid.ca/support/collab/collabviz.php, www.irmacs.ca, and www.evl.uic.edu/cavern/glvf; demo US117c.)
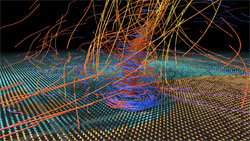
A bulk movie playback package (bplay) integrated into the OptIPuter’s Scalable Adaptive Graphics Environment (SAGE) will coordinate and display multiple incoming streams of high-definition digital images over optical networks. NCSA participates in the Global Lambda Visualization Facility (GLVF). This research is funded by the USA National Science Foundation OptIPuter and LOOKING projects, the Office of Naval Research, and the State of Illinois. Future plans include connecting NCSA to ACCESS DC and TRECC DuPage with optical networks for collaboration among the sites. The following high-definition, uncompressed, stereo visualizations will be streamed from NCSA to iGrid:
- Development of an F3 Tornado within a Simulated Supercell Thunderstorm
- Jet Instabilities in a Stratified Fluid Flow
- Flight to the Galactic Center Black Hole
- Interacting Galaxies in the Early Universe
(See www.ncsa.uiuc.edu/AboutUs/People/Divisions/divisions4.html and www.evl.uic.edu/cavern/glvf; demo US117d.)
GLVF: Personal Varrier Auto-Stereoscopic Display: This demonstration of the new NSF-funded Personal Varrier display will show how auto-stereo enables 3-D images to be integrated easily into the work environment. Personal Varrier demonstrations will include a networked teleconference between Chicago and San Diego using EVL-developed TeraVision to stream video, and local demonstrations of the European Space Station’s Hipparcos star data, NASA’s Mars Rover imagery, and various test patterns. UIC participates in the Global Lambda Visualization Facility. (See www.evl.uic.edu/core.php?mod=4&type=1&indi=275 and www.evl.uic.edu/cavern/glvf; demo US117f.)
Interactive Remote Visualization across LONI and the National LambdaRail: Interactive visualization coupled with computing resources and data storage archives over optical networks enhance the study of complex problems, such as the modeling of black holes and other sources of gravitational waves. At iGrid, scientists will visualize distributed, complex datasets in real time. The data to be visualized will be transported across the Louisiana Optical Network Initiative (LONI) network to a visualization server at LSU in Baton Rouge using state-of-the-art transport protocols interfaced by the Grid Application Toolkit (GAT) and dynamic optical networking configurations. The data, visualization, and network resources will be reserved in advance using a co-scheduling service interfaced through the GAT. The data will be visualized in Baton Rouge using Amira, and HD video teleconferencing used to stream the generated images in real time from Baton Rouge to Brno and San Diego. Tangible interfaces, facilitating ease-of-use and multi-user collaboration, will be used to interact with the remote visualization. (See www.cct.lsu.edu/Visualization/iGrid2005, www.cactuscode.org, www.gridsphere.org, www.gridlab.org/GAT, www.amiravis.com, and http://sitola.fi.muni.cz/sitola/igrid/; demo US127.)
Grid-Based Visualization Pipeline for Auto-Stereo and Tiled Displays: The OptIPuter-supported Grid Visualization Utility (GVU) facilitates the construction of scalable visualization pipelines based on the Globus Toolkit. Scalable pipeline architectures are necessary to sustain interactive browsing of large datasets, such as time-series volumes, by coordinating parallel and remote resources for large-scale data storage, filtering and rendering. ISI will demonstrate interactive point splatting of geophysical and biomedical volume data for the Varrier auto-stereo display. (See www.isi.edu/~thiebaux/gvu; demo US128.)
Collaborative Environments
UCLP-Enabled Virtual Design Studio: In this collaborative architectural design process, the Virtual Design Studio (VDS) application uses UCLP to access remote visualization and data cluster arrays to create a sophisticated production environment for 3-D digitization of existing conditions and urban and architectural design workflows. The demonstration involves the digital reconstruction of the Salk Institute for Biological Studies in La Jolla, California. VDS will assemble a collaborative work environment by incorporating variable and heterogeneous digital landscapes of maps and survey data, orthographic CAD drawings, photographs, 3-D non-contact imaging data (such as laser scanning and photogrammetry), 3-D models, and other digital imaging and visualization techniques. Advanced networks, UCLP, and high-definition videoteleconferencing will enable effective computer-supported collaborative work. This application is part of the iGrid demo “World’s First Demonstration of X GRID Application Switching Using User Controlled LightPaths.” Additional resources are provided by Canada’s Society of Arts and Technology, Canada. (See www.cims.carleton.ca, http://phi.badlab.crc.ca/uclp, and www.canarie.ca/canet4/uclp/igrid2005/demo.html; demo CA102.)
Transfer, Process and Distribution of Mass Cosmic Ray Data from Tibet: The Yangbajing (YBJ) International Cosmic Ray Observatory is located in the YBJ valley of the Tibetan highland. The ARGO-YBJ Project is a Sino-Italian Cooperation, which was started in 2000 and will be fully operational in 2007, to research the origin of high-energy cosmic rays. It will generate more than 200 terabytes of raw data each year, which will then be transferred from Tibet to the Beijing Institute of High Energy Physics, processed and made available to physicists worldwide via a web portal. Chinese and Italian scientists are building a grid-based infrastructure to handle this data, which will have about 400 CPUs, mass storage, and broadband networking, a preview of which will be demonstrated at iGrid. (See http://argo.ihep.ac.cn; demo CH102.)
Collaborative Analysis: Sandia and HLRS are developing a high-resolution architectural virtual environment in which physically based characters, such as vehicles and dynamic cognitive human avatars, interact in real-time with human participants. Collaborative environments, combined with applications for scientific visualization modeling, multiple-player role-play gaming and mixed reality sessions, enable researchers to view updates to high-resolution datasets as if those datasets were local. The datasets will be displayed at multiple locations using both unicast and multicast. (See www.sandia.gov/isrc/UMBRA.html and www.hlrs.de; demo US101.)
20,000 Terabits Beneath the Sea: Global Access to Real-Time Deep-Sea Vent Oceanography: Real-time, uncompressed, high-definition video from deep-sea, high-temperature venting systems (2.2km, ~ 360 °C) associated with active underwater volcanoes off the Washington-British Columbia coastlines, will be transmitted from the seafloor robot JASON to the Research Vessel Thompson through an electro-optical tether. An on-board engineering-production crew will deliver a live HD program using both ship-board and live sub-sea HD imagery. This program will be encoded in real-time in MPEG-2 HD format and delivered to shore via the Galaxy 10R communication satellite using a specialized shipboard HD-SeaVision system developed by the UW and ResearchChannel with early support from HiSeasNet.
The MPEG-2 HD satellite signal will be downlinked and decoded at the UW in Seattle. The resulting uncompressed HD stream will be mixed in real time with live two-way discussion and HD imagery from participating, land-based researchers working in a studio with undergraduates, K-12 students, and teachers. This integrated stream will then be transmitted at 1.5Gb to iGrid in San Diego. The transmission will utilize the ResearchChannel’s iHD1500 uncompressed HD/IP software on a Pacific Wave lambda over National LambdaRail. Multicast HD streams of the same production will be transmitted simultaneously as 20-Mb (MPEG-2) and 6-Mb (Windows Media 9) streams.
Challenges of this effort include: operating high-definition video in extreme ocean depths amid corrosive, dynamic vent plumes, capturing and processing the video aboard ship, coping with adverse weather, configuring and using satellite links for transmission, and transferring signals from the associated downlink site to a land-based IP network. Exceptional engineering is required to maximize the bandwidth available and to appropriately transmit the video via satellite paths from a moving ship at sea. This appears to be the first live HDTV transmission by cable, from the deep seafloor-to-ship, coupled in real-time with a ship-satellite-shore HD link that is distributed to a broad community of land-based viewers via IP networks. (See www.researchchannel.org/projects, www.neptune.washington.edu/index.html, www.orionprogram.org, and www.lookingtosea.org; demo US119.)
Human Arterial Tree Simulation: Brown University researchers are developing the first-ever simulation of the human arterial tree in collaboration with researchers from ANL, Northern Illinois University , and the University of Chicago. The human arterial tree model contains the largest 55 arteries in the human body with 27 artery bifurcations at a fine-enough resolution to capture the flow dynamics as well. This requires a total memory of about 3-7 terabytes, which is beyond the current capacity of any single supercomputing site, and therefore harnesses the true power of the TeraGrid by using multiple sites simultaneously to complete a single simulation − Pittsburgh Supercomputing Center, National Center for Supercomputing Applications, and San Diego Supercomputer Center for the computation, and University of Chicago for the visualization. (See www.teragrid.org; demo US129.)
Related Articles
iGrid IV: Visualization and Collaborative Environments
iGrid Part III: High-Def, Interactive, and Multicast Applications
iGrid Part II: Remote-Control Demonstrations
iGrid to Present Highest-End International Technology and Application Demonstrations


